
METROS around the world suffered a 40% ridership drop between 2019 and 2020, as the Covid-19 pandemic caused lockdowns and network closures around the world. The figures were released by the International Association of Public Transport (UITP) in its World Metro Figures 2021 statistics brief.
The brief offers data on a series of key indicators for global urban rail systems running on an exclusive right-of-way, including ridership, number of lines, network length, number of stations and fleet size.
Since the last report was published in 2018, 14 cities have opened a new metro system, taking the total number of cities with a metro to 193.
Ridership
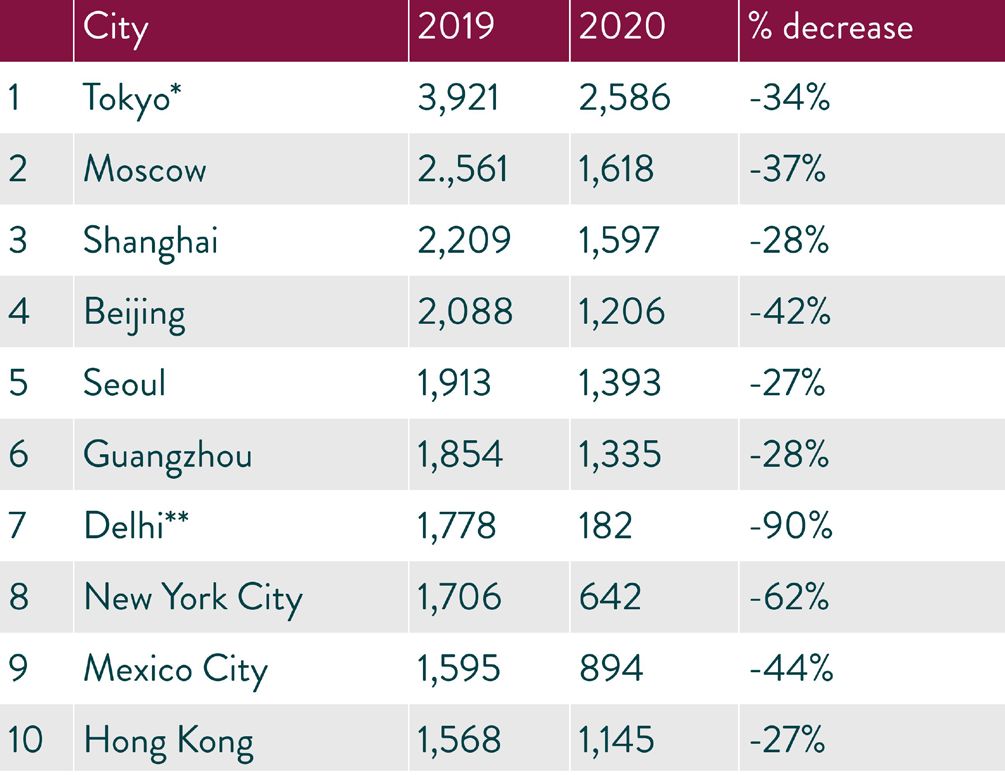
* The ridership figures for Tokyo are the aggregation of the networks of different operators, including the largest ones, Tokyo Metro and TOEI. This means that an unknown number of trips using lines of multiple operators are counted twice.
** Delhi data is for the financial year (April to March); 2020 data is an estimation, as official data was not available.
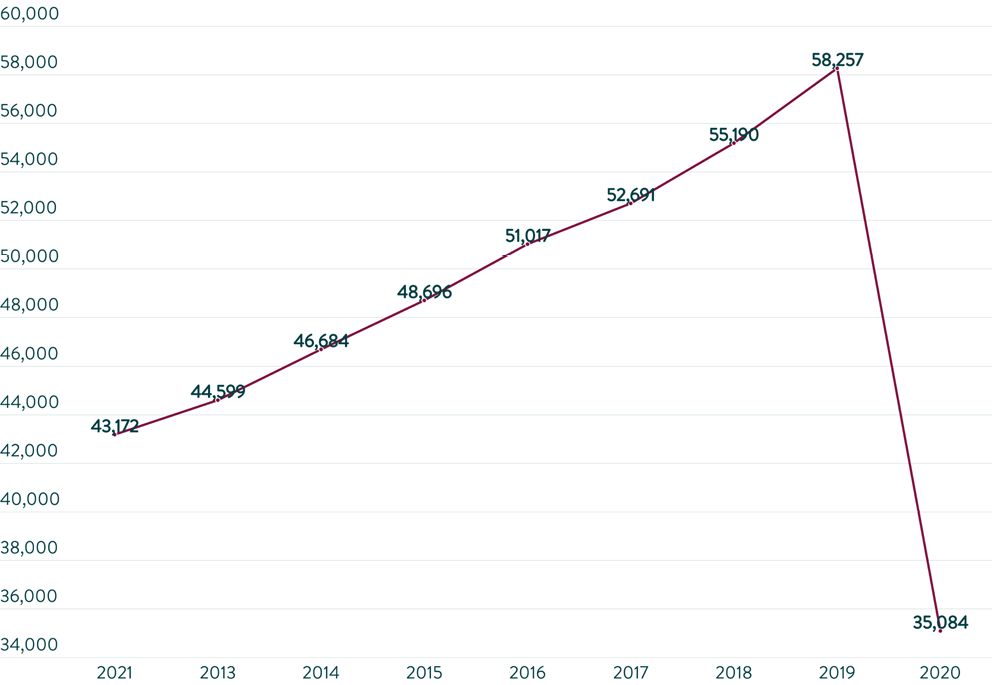
In 2019, the world’s metros carried close to 190 million passengers per day, a 20% increase compared with five years earlier. At a regional level, the ridership growth rate between 2014 and 2019 was the highest in Asia-Pacific (+44%), followed by the Middle East and North Africa (MENA) (+21%) and Latin America (+16%). Europe and Eurasia recorded a respective 9% and 3% increase. Growth during the same period in North America was below 2%, a change from the decline recorded over the three consecutive years before 2018. In Europe, ridership grew faster than infrastructure during the 2014-19 period.
Tokyo remained the busiest metro network in the world in 2019 and 2020, with 3.9 billion and 2.6 billion passengers each year respectively, followed by Moscow and Shanghai. In 2019, before the Covid-19 pandemic, there were seven cities from Asia-Pacific in the top 10. Outside the top 10, five other cities had a ridership of one billion or more passengers in 2019: London and Paris (1.5 billion), São Paulo and Shenzhen (1.2 billion) and Singapore (1 billion).
Metro ridership across the world was heavily affected by Covid-19. Of the top 10 busiest metros in 2019, New York lost close to two thirds of its passenger volume in 2020. This was the biggest drop excluding Delhi, which was closed for more than five months in 2020. In other cities from the top 10, the drop in ridership was at least 27%. The exception was Shenzhen (-13%), where the expansion of the network by one third could partially explain the relatively small drop in passenger numbers.
Globally, annual ridership dropped by 40% between 2019 and 2020. The region most impacted was North America (-63%). The decrease was somewhere between 45% and 50% in Europe, Latin America and MENA. The least affected regions were Asia-Pacific (-32%) and Eurasia (-39%).
Infrastructure
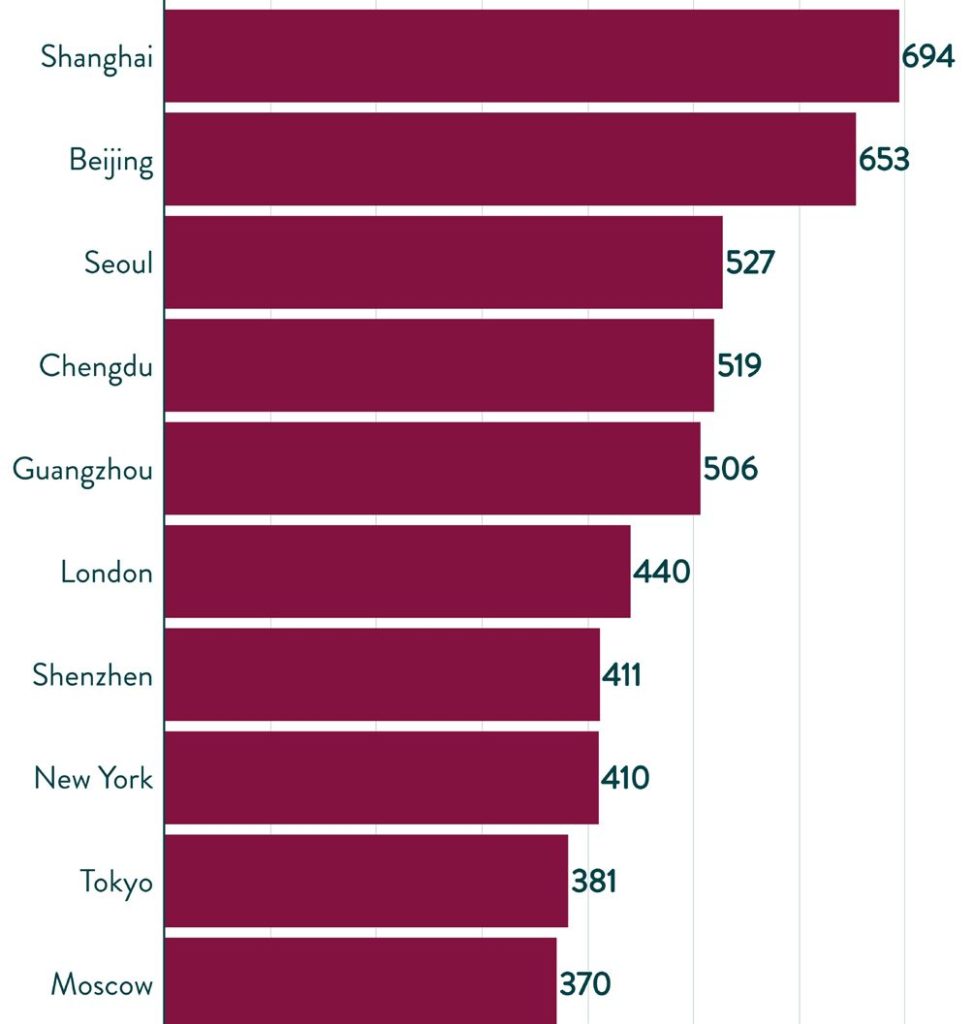
As of December 31 2020, the 193 metro systems together made up an installed asset base of 731 lines with a total length of more than 17,000km and close to 13,000 stations. Approximately 3300km of new infrastructure was put into revenue service between the start of 2018 and the end of 2020.
Chengdu entered the ranks of the 10 longest metros, jumping straight to fourth place. Guangzhou climbed two positions to number five while Shenzhen went up three positions to number seven. London is the longest network outside Asia-Pacific, ranking at number six. In addition to the cities in the top 10, five more metros had a length exceeding 250km: Delhi (345km), Chongqing (343km), Wuhan (338km), Hangzhou (301km) and Madrid (294km). The number of metros longer than 250km increased from 11 in 2017 to 15 in 2020, eight of which are in China.
It is possible to calculate the average inter-station distance by dividing infrastructure length by the number of stations. Similarly, dividing infrastructure length by the number of lines provides average line length. The longest lines on average are in the Asia-Pacific region (29km) and MENA (27km), while the shortest are in Europe and Latin America (approximately 17km). The average distance between stations is the longest in Eurasia and Asia-Pacific (approximately 1.5km) and the shortest is in Europe (1km). Eurasian network characteristics stand out in that the region has the highest inter-station distance while it has the third lowest average line length (20km).
By the end of 2020, there were metros operating at Grade of Automation 4 (GoA4) in 48 cities, meaning that more than one in every four metro systems has at least one driverless line. The total number of GoA4 lines grew from 62 to 80 between 2017 to 2020, with the total length of the automated lines increasing from 1007km in 2017 to 1350km in 2020. Fully automated metros accounted for 10% of new metro infrastructure in this period and 8% of total metro infrastructure by the end of 2020.
Rolling stock
UITP has recorded data on rolling stock from all metros around the world, using the metric of cars as this allows a better comparison than trains, which can be composed of two to 12 cars. In 2020, the total operational fleet worldwide consisted of almost 140,000 cars, which is 28,000 more than three years earlier.
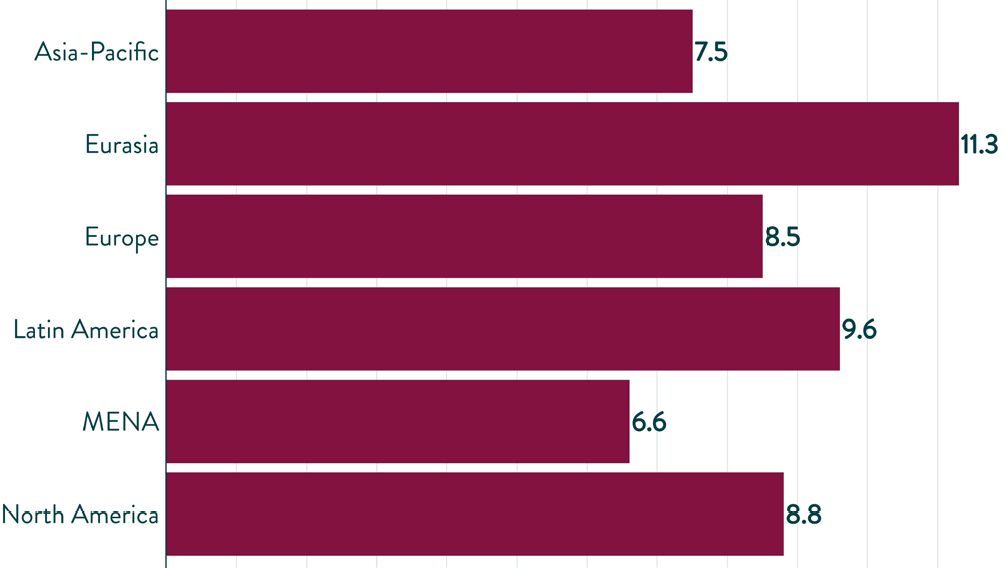
On average, fleets amounted to eight cars per km of metro line. Eurasia had the largest number of cars per km (11.3), followed by Latin America (9.6). Other continents were close to the global average (8.1), while the MENA counted 6.6 cars per km of line.
UITP says that while many networks have witnessed a recovery in passenger numbers since the pandemic, very few if any have reached 2019 levels. Despite the financial challenges, metros keep playing a crucial role to make cities liveable and sustainable.