AUSTRIA’s infrastructure manager ÖBB-Infrastructure has developed and operates a number of innovative research and development (R&D) wheel/rail interaction measuring sites in order to optimise the wheel/rail system and evaluate track maintenance procedures regarding their potential to reduce infrastructure life cycle costs. These measuring sites have already demonstrated the feasibility of wheel force measurements regarding safety aspects as well as the effect of vehicle components on running behaviour in curves.
Now we can present the next development: the world’s first system to measure wheel profiles and running behaviour (stability) at 250km/h with high accuracy. The new measuring site located at the western portal of the Wienerwald tunnel on the Vienna - St Pölten high-speed line provides a novel approach for analysing actual vehicle behaviour at speeds up to 250km/h, by combining a wheel profile measurement system with a stability measurement system and using their joint data.
High-speed train operation is challenging for infrastructure managers, operators, and vehicle manufacturers alike. On the one hand train operators want ever higher operating speeds, while on the other hand the same vehicles have to be able to run more or less optimally on mountainous tracks.
Compliance with these conflicting requirements is verified during the dynamic vehicle acceptance process. However, despite good maintenance, system characteristics can change due to normal wear and ageing leading to possible changes in a vehicle’s running behaviour. Without adequate measuring systems, it is often impractical and time-consuming to capture the various parameters in detail and to investigate their influence objectively. The idea behind integrating two independent systems - wheel profile and stability measurement - in one measuring site is to gain additional insight from the correlation between profile shape and running behaviour and the associated load collectives.
East of St Pölten, the line has a shallow curve to the right leading into the Wienerwald tunnel, which then continues absolutely straight for several kilometres. To comply with the requirements for installation and operation of innovation measuring sites, it was decided to install the wheel-profile measuring site in front of the tunnel portal, while the almost 50m-long stability measuring site was installed 2km away on a straight track section inside the tunnel. Because fast trains must slow down shortly afterwards, the measuring site was built only a short distance beyond the curve. Close positioning guarantees that every train passes both systems.
The wheel-cross-section measuring site was specially designed for this application and is the first suitable for speeds up to 250km/h. The stability measuring site is also a custom configuration developed specifically for this site. It determines dynamic vertical and lateral forces, wheel roundness and running stability. Since vehicle behaviour is strongly affected by the wheel-rail contact geometry, a new measuring rail was not installed. Instead, sensors were clamped on the existing rails to prevent the installation from making any changes to the rail properties and to determine the quality of the running behaviour on the existing track.
The measuring setup complies with an extended version of EN15654 railway applications - measurement of vertical forces on wheels and wheelsets. The wheel cross-section is added to the data from the wheel force-wheel roundness measuring site and the combined data is stored in the database using a new XML format.
As one of the innovation measuring sites is in the “vehicle fingerprint network” for protecting infrastructure and rolling stock, data from the site is not only used to analyse vehicle-track interaction but also to optimise vehicle maintenance as a pilot project. This allows the vehicle condition, such as wheel roundness and wheel cross-section, to be described as well as the particular running behaviour, especially running stability and the dynamic vertical and lateral forces, using high quality and objectively measured actual data. Corresponding technical changes to the vehicles can be evaluated immediately in cooperation with the operator. The major benefit of combining the two systems is not only the ability to prove dynamic forces and detect wheel roundness defects, but also to document them in a form which can be used in the workshop.
Although accessibility to the instability-measuring site in the tunnel is restricted, the likelihood of a failure is very small, due to extensive redundancies. Only the measurement amplifiers are installed in the tunnel and data is transferred over redundant cables to a measuring container at the tunnel portal, where the remaining equipment is located.
As the wheel profile measuring system contains high-precision photographic and laser systems, accessibility was vital, which is why it was installed just outside the tunnel portal. Although the system is exposed to all weather conditions, it is working reliably and does not require regular manual readjustment or cleaning.
The instability measuring site was calibrated in the same way as other innovation measuring sites using a special calibration vehicle. This is a two-axle freight wagon fitted with a custom-built hydraulic press which applies traceable test forces onto the measuring rail both vertically and laterally, controlled via a load cell.
The wheel cross-section measurement system’s accuracy was verified using the technical measuring vehicle and a Taurus locomotive, both of which were calibrated precisely in the depot. The train passed over the site nine times at different test speeds ranging from 60 to 250km/h. Figure 1 shows the overlaid profiles of one wheel from all measurements. The accuracy and repeatability of the measurements was very high at all speeds, which was confirmed during the first months of regular operation.
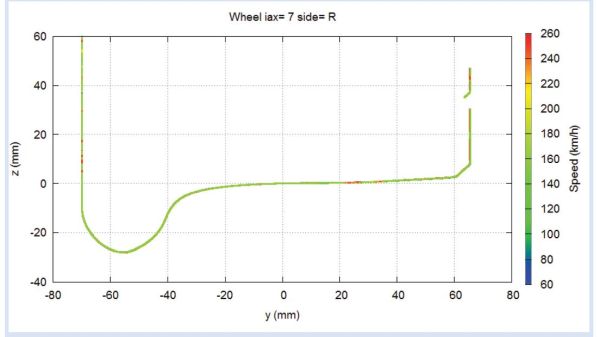
These results are very encouraging, as wheel profile measuring sites have previously been restricted to significantly lower speeds, and there has not been any practical experience at high speed.
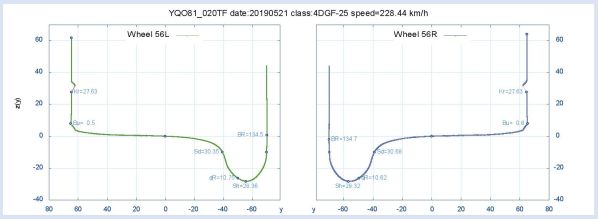
Figure 2 shows a standard graphic of a single measured wheel profile. In addition to the profile, the following parameters are given: flange height (Sh), flange thickness (Sd), flange face (qR), rim width (BR), burr, stock wear, and hollow wear, if applicable. These values are calculated directly from the (smoothed) point set according to the Locomotive and Passenger Technical Standard for Interoperability (LOC&PAS TSI).
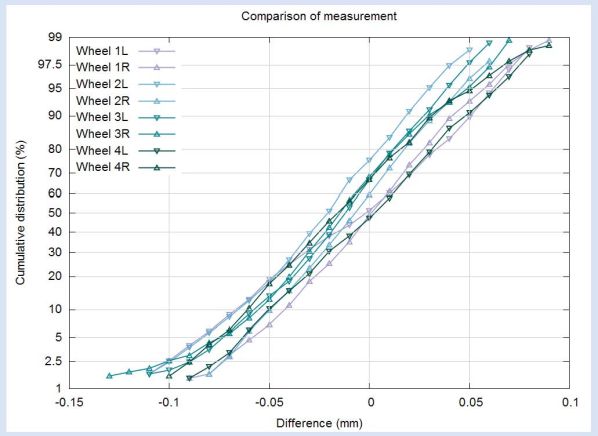
Repeatability was proven at the speed test. A comparison with manual measurements in the workshop shows statistical deviations of the profile curves using the example of eight wagon wheels (Figure 3). Conformity between both methods is very high, although the wheels were measured at different cross-sections along the circumference.
The raw data is shown in a local coordinate system; the profiles are aligned laterally at the unworn flange back and vertically at the tread datum. The deformation of the wheelsets due to the dynamic vertical forces causes a load-dependent rotation of the profile shape which only has a small influence on the statistical description of the profile, which must be considered when using the data for contact geometry analyses.
Having proven functionality and met the accuracy requirements, the primary task is now to acquire collective profile data. This will be performed within the next few years with two main objectives: first, to have the actual cross-section available to discuss wear issues, and secondly, to gain insight into changes caused by maintenance on the vehicle and track.
An example is the wear behaviour of a wheel over three months.
The principle that applies here is that gathering collective data contributes to optimising the track system, whereas vehicle-related wear issues are only considered regarding their retroactive effects on the infrastructure in cooperation with train operators during research projects.
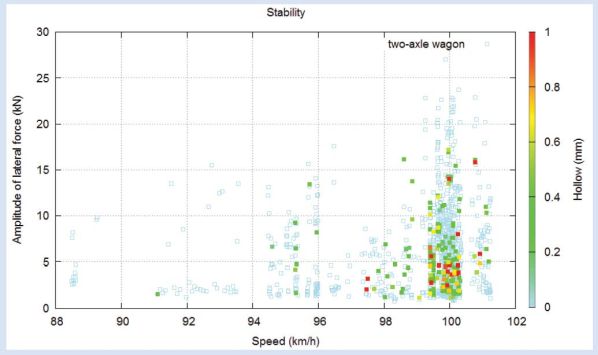
Wear behaviour leads automatically to running behaviour, which is captured at the stability measuring site in the tunnel. Further investigations into this are planned, as the interaction between vehicle and track depends on a multitude of often highly non-linear parameters. For example, at first sight there is apparently no correlation between a hollow-worn wheel and running stability. Figure 4 shows the amplitudes of the lateral forces of the wheelsets for two-axle wagons together with the colour-coded hollow tread plotted over the operating speed. In this case multi-dimensional relations, for example considering the vehicle mass and the equivalent conicity, need to be developed.
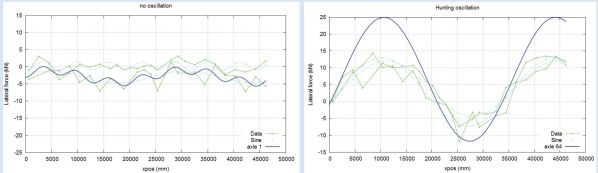
Vehicle running stability is determined as follows: the lateral force sensors of the stability measuring system acquire forces for each wheel over a length of nearly 50m. Assembled, this yields polygons with a periodic trend, overlaid with local influences of different origins. An appropriate sinus is fitted into this force line for each wheel. For the wheelset’s stability rating, the force level and the trend periodicity are relevant. The sum of the sinuses for both wheels results in the trend for the entire wheelset, which is then rated based on amplitude and wavelength. When the Prud’homme limit is exceeded, this is referred to as unstable running behaviour. Figure 5 shows the regular behaviour of one axle (left) and another axle with remarkably high lateral forces together with the associated wavelength of their occurrence (right).
The innovation measuring site has shown that even at speeds of up to 250km/h out-of-roundness and cross sections can be captured with outstanding accuracy. This is particularly useful if the running behaviour is checked at a related stability measuring site, and if the inspection of all traffic on a line is desired. High-quality objective field data is generated, replacing previous isolated measurements with a much more comprehensive data collection system. This is of immense value, especially to optimise a mixed traffic railway which cannot be tuned to a single type of vehicle. During the next few years, the site will provide the required baseline data for rebuilding the track-train interaction optimisation strategy from scratch.
This article is based on a paper presented at the WCRR Congress in Tokyo in 2019 by Paul Mittermayr from the Bureau of Applied Mechanics and Mathematics (BAMM), Vienna, Austria, Roman Schmid from ÖBB-Infrastructure, Dietmar Maicz from Hottinger Bruel & Kjaer, Austria, and Enrico Betterle and Guido Occioni from Mermec, Italy.