RAILWAYS are generally considered to have a smaller impact on climate change than other modes of transport, as they use less energy and emit less carbon dioxide. However, railways cannot avoid being impacted by climate change. In fact, railways have suffered extensive damage beyond our expectation from extreme weather events such as sudden localised heavy rainfall and gusts of wind.
Under the Japanese Railway Technical Research Institute’s (RTRI) 2015-2020 Research 2020 master plan, RTRI developed technologies to minimise the damage by weather disasters in order to respond to these intensifying weather events. These technologies are used to evaluate and analyse the hazards along railway lines in real-time, based on weather forecast data and to stop train operation and develop evacuation plans for passengers according to the hazard analysis data.
Under the new Research 2025 master plan, starting this year, we will further enhance these technologies to evaluate disaster risks based on real-time weather data and to minimise disruption.
Due to global climate change, an increasing number of localised heavy rain downpours have occurred in Japan in recent years. These extremely heavy rainstorms occur in a very limited area and tend to cause collapses of railway trackside slopes and the track bed, flood tracks and submerge vehicles. In such cases, operators slow trains down or stop services altogether depending on the amount of precipitation in order to protect trains and prevent derailments.
However, as such localised heavy rains occur so suddenly, the system relying on the data measured by trackside rain gauges may not provide the necessary information fast enough.
We will further enhance these technologies to evaluate disaster risks.
Wind gusts also tend to develop suddenly, and it is difficult to respond to them quickly if it depends on the data detected by trackside wind gauges.
We have therefore developed a “real-time hazard map” to detect disaster risks caused by these extreme weather events in real-time and prevent the risk and damage using weather forecast data provided by public meteorological organisations.
The hazard map (Figure 1) uses weather radar data and weather forecast data provided by public meteorological organisations and analyses the hazards of high winds, floods and large-scale landslides.
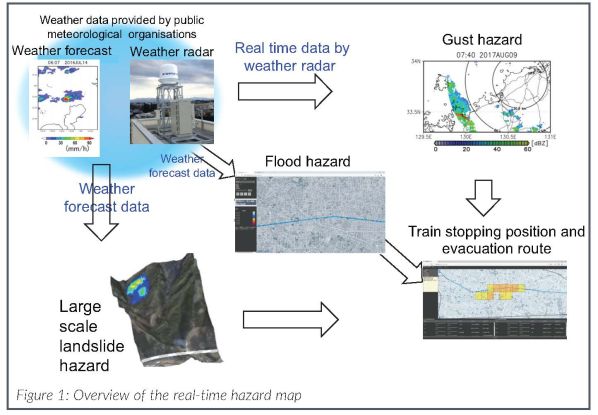
High winds are analysed and identified by detecting raindrops showing distinct movement, using the data of the direction and velocity of moving raindrops provided by weather radar. Since the radar provides geographical forecast data every few minutes, this system can use the data to calculate successive locations of ever-changing high winds.
In analysing flood hazards, the predicted precipitation value at each 700m grid-point provided by the National Research Institute for Earth Science and Disaster Resilience, one of RTRI’s collaborative research partners, is input to a ground model, and the water volume flowing into rivers and channels along the slopes is calculated. Each of the river levels is then calculated based on the flow volume. If the water level exceeds the height of a bank, it is recognised as a bank overtopping. The system also calculates the spread of patterns of water flowing down the slope in just a few minutes and can predict possible inundation areas every 10 minutes.
In recent years, we have experienced increasingly severe weather events such as super typhoons and stationary weather fronts that cause record amounts of rain.
Using the same weather forecast data, large landslide hazards can also be evaluated. Hazardous slopes are identified in advance, using a process established to specify them based on the geographical data of the locations that were previously hit by large landslides. The limit of the area that the debris from a landslide might reach is calculated, and if the predicted rainfall exceeds the limit volume, the occurrence of the hazard is indicated.
Based on the results of hazard analysis, the prototype real-time hazard map can display positions where trains should stop and potential evacuation routes for passengers. Figure 2 shows an example of the display.
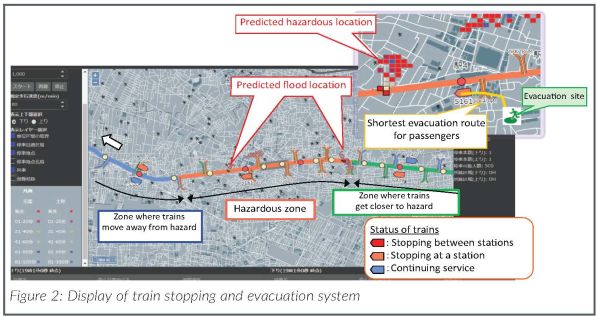
Train stopping positions are calculated for each of three categories of zone, depending on the predicted hazard locations and position of trains. An orange-coloured area indicates a hazardous zone, including predicted hazard points and an in-between area. A green-coloured area indicates zones where trains are travelling towards the hazardous zone, and in blue-coloured zones trains are moving away from the zone. Figure 2 shows zones divided by colour for trains running from right to left.
On the upper right of Figure 2, a part of the hazard zone is zoomed in. Here, a route to the nearest evacuation site is shown, assuming passengers need to evacuate the train. Basically, this system calculates the stopping point so that the train can stop at a station, but it might be necessary to stop a train between stations. In this case, the stopping position is calculated to minimise the time needed for passengers to reach the pre-determined evacuation site.
RTRI is currently testing the hazard map system at two locations in Japan in order to verify the accuracy of its analyses. We want a clear understanding of how accurately the system can simulate actual inundation areas and the time the hazard occurs. Based on the test results, we will propose how to use this system in actual train operation.
Under Research 2020, RTRI undertook technical developments to prevent disasters and mitigate the damage caused by extreme weather events such as localised downpours and gusts that occur very rapidly, using weather forecast information.
In recent years, we have experienced increasingly severe weather events such as super typhoons and stationary weather fronts that cause record amounts of rain. Although to some extent these phenomena can be predicted in advance, they are likely to cause extensive damage.
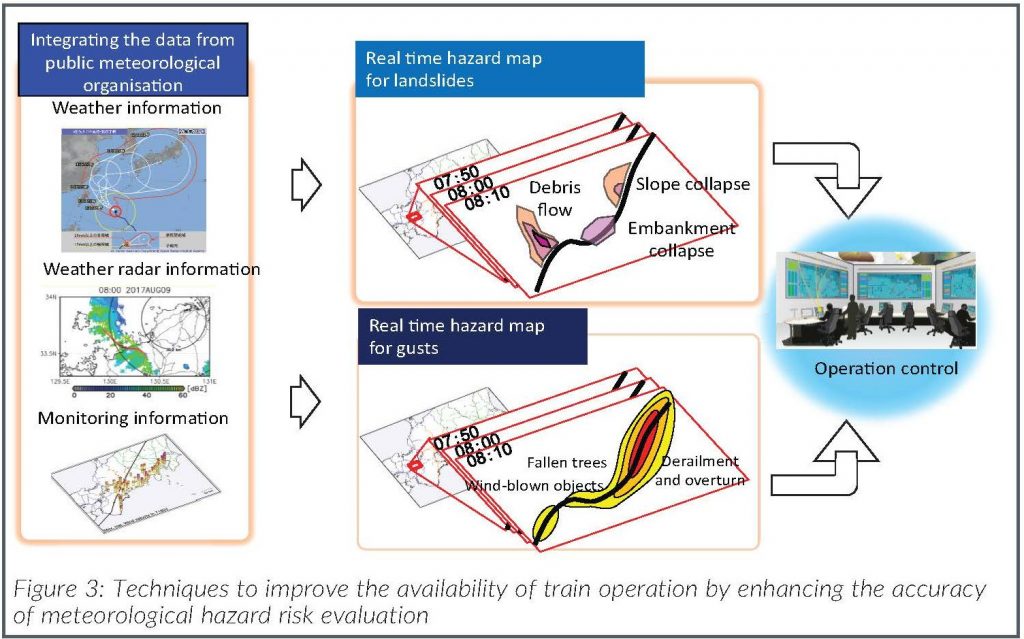
Under Research 2025, we will develop a method to evaluate the disaster risks of extremely severe downpours and high winds using the real-time data of cumulative rainfall and wind velocity provided by a public meteorological organisation. With this method, we will be able to shorten train down time by increasing the accuracy of operation regulations (Figure 3) and propose optimum emergency restoration measures quickly according to the conditions of the damaged slopes and embankments. These technical developments will help us avoid disrupting passenger services as well as ensuring their safety during disasters.