Cyril Verdun and Pierre Audier from SNCF and Fabien Turgis from Ikos explain how this has improved performance and reduced costs.
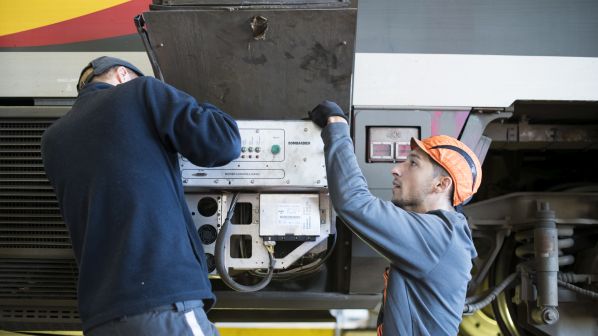
The French National Railways (SNCF) train maintenance system was characterised by a combination of several maintenance types and strategies ranging from preventive systematic maintenance to corrective maintenance. However, the emergence of new information technologies such as the internet of things (IoTs) coupled with the entry into service in Paris of Bombardier Spacium commuter EMUs equipped with sensors have driven changes to the way SNCF maintains its trains. The introduction of onboard/wayside diagnostic systems presented a significant opportunity to cut maintenance costs while at the same significantly improving reliability, availability and service quality.
When the trains were introduced 10 years ago, Ile de France transport authority and Bombardier did not foresee all the challenges and possibilities offered by this project.
These highly complex trains with electronics, informatics, data networks and onboard computers need highly-skilled people to maintain the fleet in operational condition.
This was the first project to fully implement functional analysis, failure modes and effects analysis (FMEA) and logistic support. The introduction of onboard/wayside diagnostics systems made it possible to introduce condition based maintenance (CBM) into the maintenance monitoring process.
It is interesting to note that even if remote diagnosis and CBM were perceived as modern gadgets at the beginning of the project, they became increasingly valuable over time and are now considered as a major change in train maintenance. Indeed, they change the way to conceive, schedule and industrialise maintenance. Today’s processes are no longer the same. Moreover, they present a significant opportunity to reduce maintenance costs, while also having a positive impact on reliability, availability and service quality.
SNCF rolling stock engineering is currently using remote diagnosis to optimise maintenance. Fault or status codes, counters and associated parameters such as GPS position, date, time, or operating diagram are used to optimise:
- availability and corrective maintenance - by setting specific equations and filters, it is possible to capture failure alerts and health status and to plan appropriate corrective maintenance; for example, if an obstacle is detected during a door closing cycle, it could be due to an action by a passenger, but if an obstacle is detected on consecutive occasions when a door closes, this could be a specific door failure
- systematic preventive maintenance - direct information provided by counters leads to a change in preventive maintenance steps, while all the captured codes and their parameters will provide a huge amount of data for maintenance feedback and calculating the remaining useful life (RUL), and
- maintain in operating conditions - dynamic dashboards fed by data are used for decision help support. This allows key performance indicators (KPI) and main train systems to be monitored in real-time to aid management.
Besides remote diagnosis, CBM is also used to prevent failures and to reduce the amount of maintenance required. In addition to the data used for remote diagnosis, analogue data sent by the train are captured and analysed. As each subsystem is characterised by specific properties during its nominal operating cycle, comparisons can be made to detect deviations, abnormal behaviour or remarkable observations using expert systems.
For each system or subsystem, indicators can be computed and classified at several levels of criticality to determine the degree of system degradation. In addition, each indicator is associated with parameters such as the train number, date, time, operating diagram, and GPS position stored in a database. Using these indicators and parameters, system health status can be computed and used to delay or eliminate a preventive maintenance step.
Moreover, when the health status is considered too bad, alerts can be created for corrective maintenance. For example, the repetition of a deviation observed in traction motor current can be attributed to an abnormal behaviour.
From the data acquisition step to the creation of a maintenance order, remote diagnosis and CBM can be presented as a data value chain (Figure 1). First, all the available system data are recorded directly from the train network or connected sensors (IoT) either onboard or on the wayside. Once data from each system are captured, they are transmitted to the wayside via a physical or cloud server.
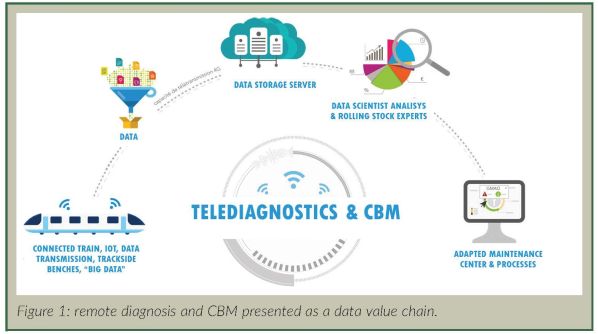
remote diagnosis and CBM can be presented as a data value chain
Raw data are then filtered and processed to transform analogue and logical data into health indicators. These indicators are processed to define prognostics based on expert systems. Prognostics results are converted into maintenance orders which can be understood by maintenance staff and train schedulers. The maintenance orders are dispatched via the informatics systems and can be visualised using specific tools.
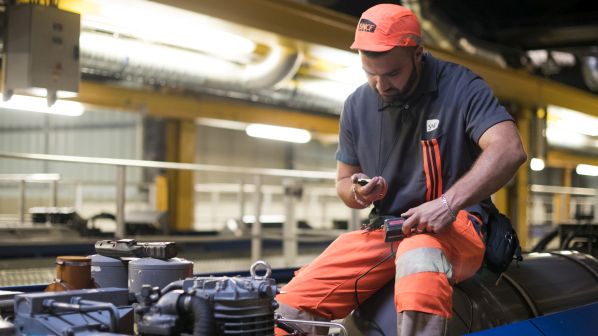
One of the keys to success is to combine skills from data scientists and rolling stock experts to create relevant prognostics. It was decided to prioritise such a system as an alternative method rather than using machine learning or artificial intelligence turnkey solutions.
Indeed, SNCF has several experts for each train system, and it made more sense to use their precious technical skills by combining them with the data brought by data scientists to create one expert system for each system to be maintained. To date, CBM is applied fully to compressors, passenger access, toilets, and heating ventilation and air conditioning (HVAC).
This digital transformation has changed the way SNCF operates its maintenance system, from the manager down to the maintenance technician. Before preventive scheduled maintenance was introduced, train inspection frequency was determined by the number of operating days and/or the distance travelled. Each inspection consisted of several maintenance tasks scheduled by the fleet technical supervision unit which assigned specific infrastructure, tools, time windows and technicians to a train for each operation. Under this system, the supply of replacement parts and train downtime must be anticipated, as the need for corrective maintenance is known only after all tasks have been checked.
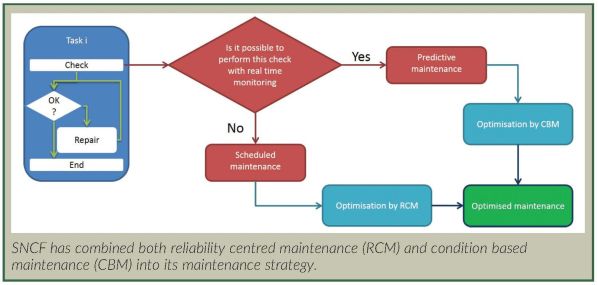
The new maintenance strategy combines both preventive scheduled maintenance and condition based maintenance, with the objective of increasing safety, availability, reliability and reducing the frequency of scheduled maintenance. However, some preventive scheduled maintenance tasks, such as lubrication or visual inspections, cannot be eliminated as they require human intervention. This also concerns components, functions and failure modes which are not affected by the monitoring system.
To develop the maintenance system based on data analysis, existing maintenance plans were analysed and broken down for each specific system according to opportunities highlighted by data analysis. First, the maintenance tasks that can be realised, delayed or eliminated using real-time monitoring and data analysis were identified, while reliability centred maintenance (RCM) is carried out for the other tasks. The maintenance plan was then reshaped to separate those maintenance tasks which can be realised using real-time monitoring and CBM from those which cannot.
After data analysis, a “connected” traceability with pre-validated maintenance operations is edited and incorporated into the preventive scheduled maintenance process. For example, four tasks related to door maintenance covered by connected traceability meant that only 13 interventions were needed on a six-car train instead of 48 systematic inspections and interventions.
Connected traceability has several benefits:
- preventive maintenance steps can be delayed or replaced by CBM - for example, if all systems are found to be working normally just before a depot visit, the visit can be postponed
- preventive maintenance steps can be maintained, but the maintenance time will be reduced as only non-validated operations need to be carried out, and
- corrective maintenance can be done while other maintenance is being carried out.
To aid the management process, all processed information is collated and presented in a visualisation tool to support decision making. For example, a train fleet is shown with specific patterns and colour codes using squares to represent each train. The colour in each square refers to the criticality level of a system and the size of the square relates to the time needed to fulfil a specific maintenance visit.
Digitalisation has changed the way we conceive, schedule and industrialise maintenance. This is such a long and complex procedure that it requires strict control and the correct formalisation of every process. In the beginning, some workshops were appointed as pilot locations and have now totally switched to the digital era.
However, one of the biggest challenges was to provide change management support and training for people. While the younger generation is familiar with data and computer-based work tools, older employees may be unwilling to change the way they work and often need support.
SNCF has built a global framework to control and support this digital transformation at every level of the company. Indeed, change management is a key element of the whole data value chain. You can have the best algorithms and the best prognosis, but if maintenance staff do not change the way they work, there is no point.
Today, about 250 Bombardier Spacium EMUs are operating on Paris suburban services and performance measured over the last five years has resulted in:
- the number of breakdowns being reduced by half, while the efficiency of troubleshooting agents has been strongly reinforced by data analysis tools
- a 30% improvement on entrances/exits at maintenance depots, representing a gain of two trains per site
- a 20% cut in the number of trains taken out of service for maintenance, and
- a 20% reduction in maintenance costs.
This new maintenance strategy also represents a huge potential for infrastructure maintenance by using all the data available in the train to monitor infrastructure. For example, trains are used to identify areas where catenary voltage dips or to spot track adhesion problems.
The emergence of onboard/wayside diagnostics system and trains equipped with sensors offers a significant opportunity to reduce maintenance costs, while also having a strong positive impact on reliability, availability and service quality. This has enabled SNCF to develop a new maintenance strategy, combining remote diagnosis, preventive scheduled maintenance and condition based maintenance.
SNCF has also built a global framework to control and support this digital transformation at every level of the company, to face the deep change in its whole maintenance system.This strategy is now fully operational on one of the most important mass transit fleets in Europe and the results can already be seen.