TRAIN dispatching on busy suburban lines is complex, as many factors must be taken into account at the same time. Even without major disruptions, small delays can easily occur, especially during peak hours, for example, due to increased dwell times at a station caused by heavy passenger flow. As trains run at short headways, delays can propagate and impact many trains with a snowball effect. This makes it difficult to provide a high-quality service for commuters. During operation, dynamic dispatching decisions must be taken which include adjustments to train schedules and services, timetables, rerouting, and junction rescheduling.
On high-frequency lines, conflicts at Y-shaped junctions - the most common on a network - arise as soon as trains run out of schedule. One train needs to wait for another to pass through the junction, with potential consequences for many trains behind, and therefore many passengers.
In such situations, trains can be rescheduled to minimise delays. Rescheduling should take account of the impact on the whole line and consider elements such as the type of service, current delays, and the effect on passengers on the trains and waiting at stations. Moreover, the operator has very little time to make a decision. In such a complex situation, operators can benefit from a decision support tool to assist them in the dynamic rescheduling management task.
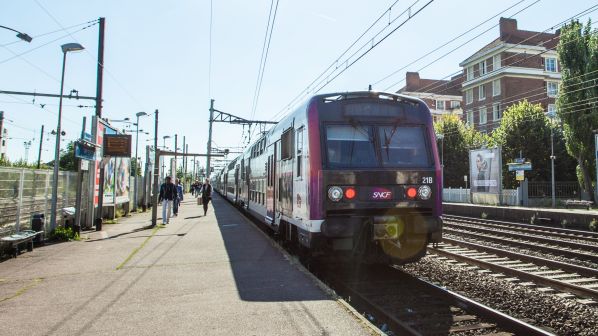
SNCF Transilien operates 6200 trains per day on 13 suburban lines in the Paris area, carrying more than 3 million passengers daily, making it one of Europe’s largest and busiest networks. Up to 32 trains per hour can pass through junctions.
Traditionally rescheduling decisions aim to minimise train delays. However, since 2016 the performance of Transilien services has been evaluated according to punctuality, which is based on the percentage of passengers reaching their destination on time. Minimising train delays usually has a positive impact on punctuality, but punctuality is more complex as trains are not equally loaded and passengers are not evenly distributed over all origin-destination pairs.
Actions taken to minimise the impact of delays include real-time rescheduling of timetables and rolling stock and crew rosters. This includes adjusting the speed of trains or station dwell times in order to maintain a regular interval between trains, changes to train schedules, or modifying scheduling on some parts of the network such as junctions.
SNCF Transilien measures punctuality as the percentage of passengers arriving on time at their destination, with a tolerance of five minutes. Punctuality is computed by comparing the arrival times of passengers with train arrival times provided all trains run according to the timetable based on the following data:
- the theoretical timetable
- passenger demand for each one-hour timeslot and each origin-destination pair, and
- actual train delays, rescheduling and cancellations.
The first two types of data provide some knowledge of the theoretical arrival times of passengers to serve as a reference. To compute arrival times, we assume passengers arrive at a station 3 minutes before the theoretical departure time of the train they plan to catch. Each passenger is then assigned to the first train actually running serving both its origin and its destination. We finally compare the actual arrival time of each passenger with their theoretical arrival time and denote them as on time if they arrive less than five minutes beyond their theoretical arrival time.
The objective is to better reflect the impact of delays on passengers, rather than focusing only on train delays. Indeed, especially on high-frequency lines, the theoretical timetable of trains has little importance with respect to other parameters such as travelling and waiting time. Obviously, a delay to a train full of passengers is of greater concern than the same delay to an empty train.
However, passenger punctuality is not only a weighting of train delays by the number of passengers. Indeed, delayed passengers might be travelling on trains which are on time if they expected to board an earlier train which was cancelled and had to wait for the next one. Conversely, on-time passengers might also be travelling on delayed trains, for example, if all trains run late but at the scheduled time of succeeding trains.
Criteria
As passenger punctuality is a key performance indicator to assess service quality, punctuality was chosen as the optimisation criteria for the decision support system.
Real-time junction rescheduling decisions are taken by operators thanks to their expertise, and following SNCF guidelines. The choice is usually made between the two trains approaching the junction, taking account of delays, train type, and stopping patterns. When disruptions occur, operators have a high cognitive load and must execute multiple tasks within a short period of time. Each decision can have a major impact on service quality.
It is nearly impossible for a human operator to make decisions according to the punctuality criteria already described. Potentially, all origin-destination flows should be considered, and rescheduling can impact subsequent trains and passengers. Moreover, trains have different stopping patterns and therefore different travelling times between stations.
Our objective is to help operators make decisions from the perspective of passenger punctuality and to provide a decision-support tool which:
- fits with the current operating mode, providing recommendations on the order of trains at the right times when the operator would naturally make a decision
- provides information on the impact of the decision on traffic and passengers, and
- helps to reduce the cognitive load, allowing the operator to focus more on other tasks.
Our decision-support tool recommends in real-time the ideal order of trains in order to maximise passenger punctuality during the day over a entire line.
Input data consists of both static and real-time information. Static data correspond for example to network representation and capacity, the theoretical timetable, and statistics on passenger demand. The latter consists of data on the number of passengers travelling on each origin-destination pair during fixed time periods. Passenger data is collected through periodic manual counting on a representative day.
Real-time data mostly consist of the real-time position of trains provided by on-track sensors, the spacing of which can vary between 100m and 2km, and train cancellations. Train position data is not continuous but discrete information triggered by the activation of the sensor. While this usually provides an accurate estimation if a train stops for some reason, the latest known position corresponds to the last activated sensor and no update is sent until the train passes the next sensor.
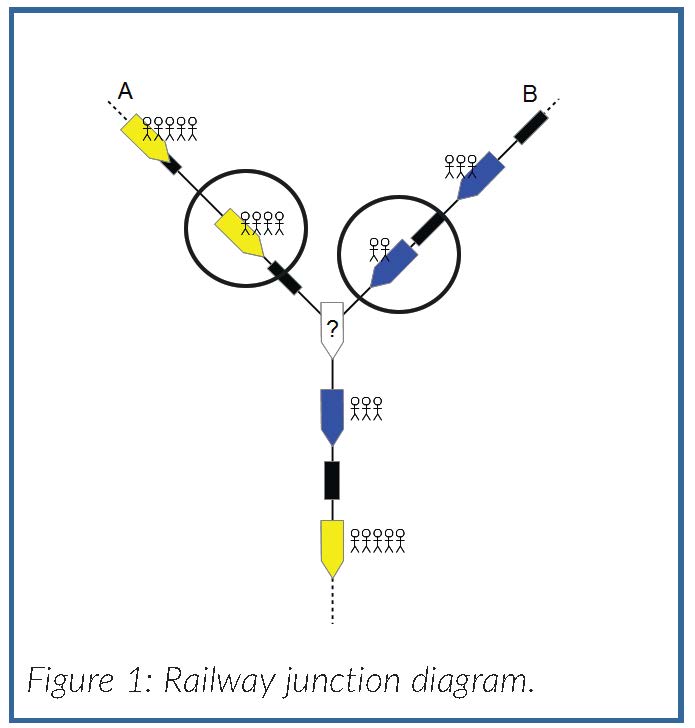
At startup, the tool is initiated with the theoretical timetable and passenger demand. The software updates the traffic according to real-time train position information. At every update, the system detects the two trains closest to the junction on each branch (circled on Figure 1) for which a decision must be made. The software runs two simulations corresponding to the two options for ordering the trains through the junction. Each simulation takes account of real-time train position information to estimate the future arrival times of each train at each station. The tool uses a macroscopic traffic simulator developed by SNCF’s Innovation and Research Department (Figure 2).
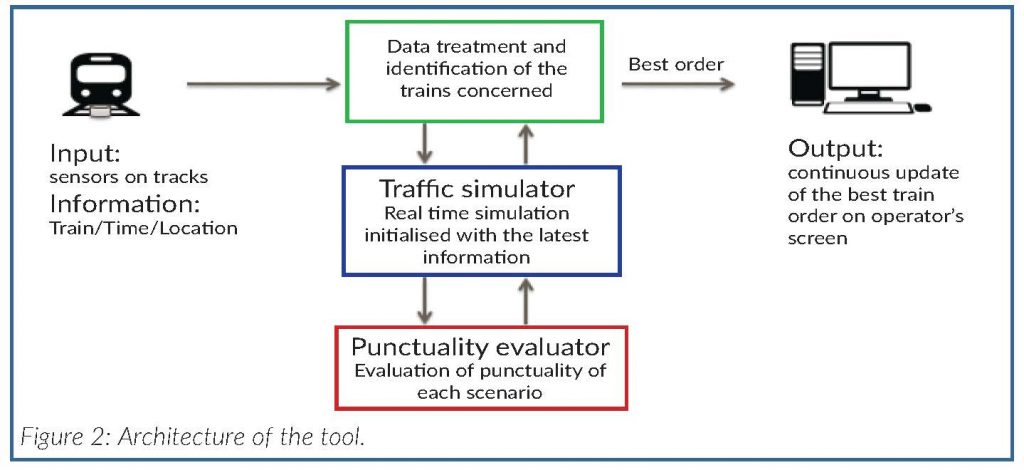
Once the past, present, and future positions of all trains are known through simulation, a punctuality evaluator estimates the assignment of passengers to trains and the arrival time of passengers for each of the two train ordering scenarios. This enables a punctuality estimation to be computed for each scenario. Information on the best scenario, as well as all useful information to aid decision making, is presented to the operator. The graphical user interface was developed with the help of cognitive science experts and operators to be effective and practical in high cognitive load contexts.
Several experiments with the tool have been conducted at the most critical junctions in the Paris area. The latest experiment was carried out at the western end of RER Line A and Transilien Line L. The tool was tested by operators for three weeks between 07.30 to 09.30.
The first indicator we were interested in was the quality of the traffic simulations. We computed the differences between the forecasted and the measured train times for different time ranges starting from the moment the simulation started. Figure 3 shows the deviation distribution, based on 1500 simulations for each 5-minute slot from 0 to 30 minutes after the simulation.
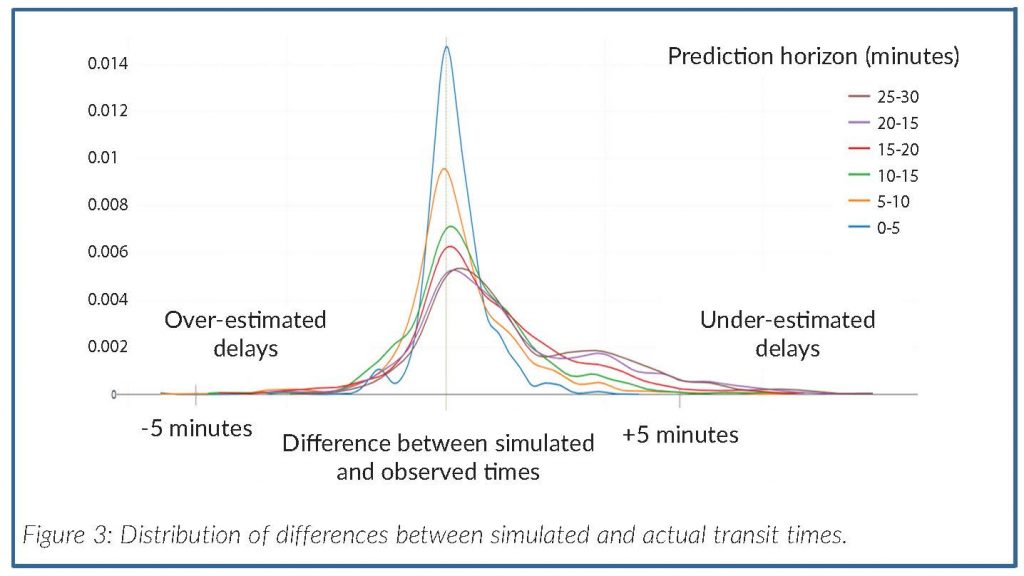
Between 0 and 5 minutes after the simulation, the average train position error was 5 seconds, whereas for longer periods, the average error was larger - 40 seconds for between 20 and 25 minutes. This is expected, as disruptions are more likely to occur as time passes.
Passenger delays are computed based on the simulation, which means the precision of their arrival times is directly related to the quality of the train simulations. Analysis of the train position forecasts demonstrates good precision and that the tool makes good quality re-ordering recommendations.
We compared the tool’s rescheduling recommendations with those implemented by the dispatcher (Figure 4). In 84% of cases, the decisions by the tool and dispatcher were identical (blue and green sections of the pie chart), 11% of the recommended rescheduling were not implemented (orange), and 5% of the implemented rescheduling were not recommended by the tool (red).
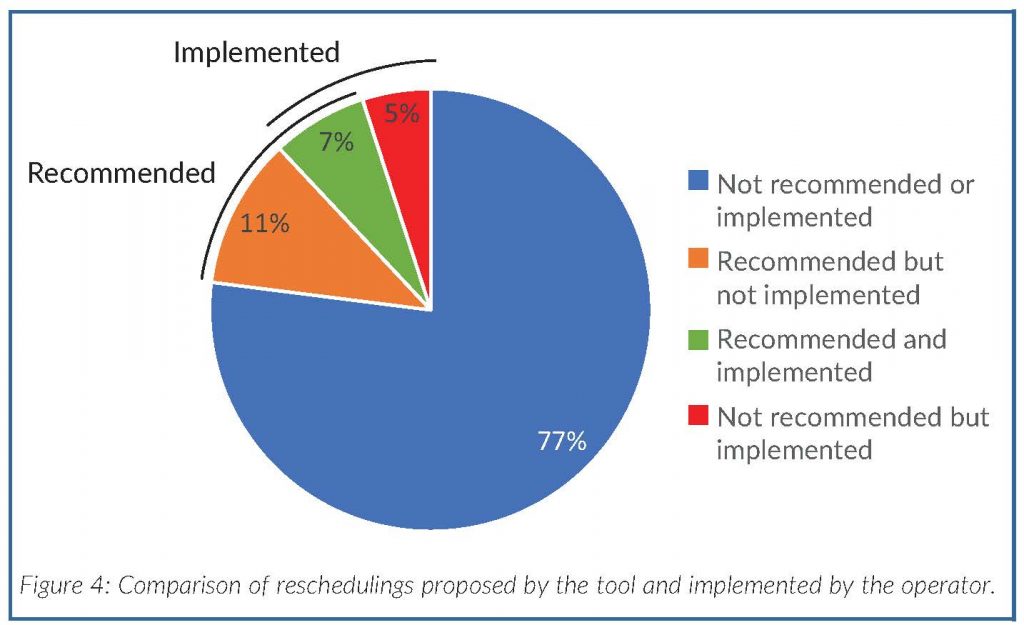
The discrepancy was due to the complexity of the passenger punctuality criteria: most of the non-implemented rescheduling proposals maximised passenger punctuality but did not reduce train delays. Other reasons not to follow the recommendations are linked to rerouting, which is sometimes implemented by operators and is not modeled in the prototype, making simulations irrelevant, or to rolling stock and driver schedules as delays might be propagated to future trains assigned to the same unit or driver. Future versions of the tool could integrate rerouting and the impact of re-ordering of train and driver schedules, making the recommendations more accurate.
Finally, a survey of operators regarding the experiments and the prototype was mostly positive both for the recommendations made by the tool and the quality of information presented in the interface. The tool significantly changes the approach by operators to the task of supervising junctions, and this should be considered while managing the implementation of the tool.
Improvements to the tool could include the integration of other features such as rolling stock and crew scheduling, and the consideration of junctions with mixed traffic such as freight or long-distance passenger trains. The tool could also inspire future traffic management systems for dense traffic areas.