WHEN railways and climate change are mentioned together, it is often to highlight rail as the ideal transport mode to combat global warming by reducing greenhouse gases and other emissions through mass rather than individual transport.
But the industry cannot think solely about how rail can aid the fight against climate change without considering the effect a changing climate will have on future rail projects and existing operations.
Railways are regularly affected by different meteorological events such as storms and heavy rain, while seasonal issues such as snow and leaves on the rails also impact operations. Warmer winters and hotter summers combined with the more extreme weather events that climate change is predicted to bring will compound these issues for operators and network managers.
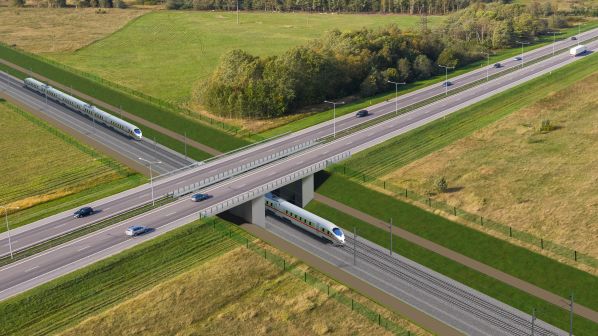
Rail Baltica is an 870km, mixed-traffic standard-gauge railway with a design speed of 240km/h, running from the Estonian capital Tallinn, via Riga and Riga Airport in Latvia, and Panevezys and Kaunas in Lithuania, to the Polish border with a branch from Kaunas to the Lithuanian capital Vilnius.
The line, which is currently in the design stage, will be built through a region that has traditionally had cold snowy winters, heavy frosts and mild summers. But this could change over the next few decades, according to a report commissioned by RB Rail, the body tasked with overseeing the multi-national project.
The Study on Climate Change Impact Assessment for the Design, Construction, Maintenance and Operation of Rail Baltica Railway, released on September 15, details the expected changes in the region’s climate and weather patterns and outlines the risks faced by the project, along with a list of adaptive measures.
The long-term climate forecasts in Estonia, Latvia and Lithuania were based on two global climate change scenarios: the moderate RCP4.52 scenario and extreme RCP8.5 scenario selected from the Euro-Cordex ensemble, a programme sponsored by the World Climate Research Program (WRCP) to organise an internationally-coordinated framework to produce improved regional climate change projections worldwide.
The current situation
To paint a picture of the region’s current climate, the report gathered information and data from various studies, along with historic data from the World Meteorological Organisation’s 11 closest meteorological stations, creating a description of typical weather patterns between 1981 and 2010. The report also incorporated the characteristics of extreme weather events between 1981 and 2017.
Overall, the report found that the southern Rail Baltica route tends to be warmer and sunnier than further north, while the mean annual temperature along the corridor varies from about 5.5°C to 7.1°C. Higher values occur in Lithuania, where mean temperatures are between 1-1.5°C higher than Estonia.
February is normally the coldest month, with winter temperatures along the route largely influenced by the proximity to the surrounding sea. July is normally the warmest month, with mean daily maximum temperatures of around 18°C.
The biggest weather risk is characterised by intense and prolonged rainfall: 30mm or more falling in one hour, or 50mm or more falling in 12 hours, is classed as dangerous, with the potential to cause flash and pluvial floods.
Rainfall tends to be associated with Atlantic depressions or with convection, and the report notes that Atlantic Lows are becoming more vigorous in autumn and winter, bringing most of the precipitation, with rain more common than snow. In summer, convection caused by solar surface heating forms shower clouds and a large proportion of rainfall is from showers and thunderstorms.
The highest recorded precipitation in one day between 1981 and 2017 was 86.8mm in Estonia, 75mm in Latvia and 86.2mm in Lithuania.
Snow on the ground is historically the defining feature of the winter season in the Baltic States, but the annual total number of days with snow cover has declined considerably over the last few decades. Snow coverage has been intermittent, characterised by an unexpected appearance and disappearance, intermingled with wet snow. In general, the numbers of days with snow falling and lying show an increase in relation to inland conditions, so values reflect the proximity to the seacoast. Over the past few decades, the snow cover tended to melt multiple times during the winter.
“A map produced by the Lithuanian Geological Survey registers a number of landslide events which could pose increased risks. ”
The areas with the highest average annual number of blizzards in Estonia was Tallinn, with 5.78, and Pärnu, with 3.86, during 1981-2017. The longest-lasting blizzard, 32 hours in total, was recorded in Tallinn in December 1981. In Latvia, the average annual number of blizzards is highest in Ainazi with 7.2 a year, while in Lithuania, the average annual number of blizzards is highest in Panevezys with an average of 12.
While there is little to no risk of landslides affecting the project in Latvia and Estonia, a map produced by the Lithuanian Geological Survey registers a number of landslide events which could pose increased risks.
Wind conditions along the corridor vary depending on the proximity to the sea, openness of the landscape and other factors. The annual average wind speed varies from 2.6m/s inland to 3.8m/s in coastal zones or open landscapes.
The risk posed by wind with an average speed of 21m/s, which can break trees and cause damage to buildings, is high. The strongest winds are associated with the passage of deep areas of low pressure, the frequency and strength of which is greatest from late September to February, when mean speeds and gusts are strongest.
Thunderstorms can also lead to severe damage to infrastructure from lighting strikes and the associated electrical discharge. Estonia records an average of around 15 days with thunderstorms a year, while Latvia records between 14.5 days in the coastal areas of the Baltic Sea and 23 days in the upland areas of the eastern part of the country. In Lithuania, there are 19-30 days with thunderstorms per year, on average, increasing to between 40 and 45 days in some years.
Ground frost occurs on average less than 80 days a year along the southern section of the route and more than 115 days on the northern route. Events with medium fog, with visibility reduced to 500m, occurred 16 times in Tallinn and 33 times in Pärnu. The foggiest months are March and April, though foggy days occurred in late autumn and during winter in Pärnu.
Future climate
The report predicts, with high confidence, that in the coming decades the region will experience milder winters with less snow and a lower spring peak runoff. Frost days will decline by up to 80 days per year by 2100, and winter temperatures in the region could even peak at around 0°C. The snow cover will decrease substantially and will not permanently form while the frequency of freezing rain and hail will increase, but the region will still experience short periods of intense cold weather.
More heatwaves are likely, along with higher temperatures, including an increase in the maximum summer temperatures by up to 5°C, which could lead to maximum temperatures of 40°C, according to the worst-case scenarios. The risk of wildfire will also increase.
The study also predicts, with medium confidence, an increase in the average wind velocity in winter, bringing an increased likelihood of storms, although the average annual wind speed is not expected to change by much. Wind gust speeds and the likelihood of storms during summer may increase, while the number of thunderstorms will also grow.
Climatic projections estimate an increased likelihood of more severe heavy rain and flash floods in the future, with the likelihood of extreme precipitation increasing by up to four times in winter and more than one-and-a-half-times in summer, according to the RCP8.5 scenario.
Adapting to the risks
The report notes that it is not intended to replace or define the project’s design standards which the developers are currently following, but the points raised and issues identified will be incorporated into the project as it is developed.
“This kind of approach is unique in the Baltics, and therefore it is important to note that the management of climate risks should be integrated into the general risk management, monitoring and control systems of Rail Baltica and not managed as a stand-alone subject,” says Mr Lauris Ivanovs, RB Rail technical interface management team leader. “We have obtained evidence-based information about possible scenarios in the Baltic region. However, it is our plan to discuss the findings with academics and experts to further expand our expertise in this area.
“The study identified vulnerability to climate change and outlined necessary long-term adaptation measures, including technical, technological or operational, arising from, for example, increased temperature, extreme precipitation, and increased risk of flooding. As a result, guidelines will be developed to incorporate adaptation measures in the railway design phase.”
The report identified a number of hazards caused by climate change which would not directly impact the project, including sea level rises, changing sea temperatures, the urban heat effect, solar radiation, coastal erosion, and changes in the length of the vegetation season.
All the analysed risks that would impact the project, except fluvial flooding on larger rivers, were ranked as medium or high risk, which the report says “clearly indicates that most of the consequences analysed in the vulnerability assessment have a considerable likelihood of manifesting during the life-cycle of Rail Baltica.”
“This study keeps in mind the construction, operation and maintenance periods, thus giving additional information to the future infrastructure manager as well as the potential operators for their services.”
Mr Lauris Ivanovs, RB Rail technical interface management team leader
Subsequently, the study developed a series of adaptation measures for the consequences and associated services or assets. These include a range of measures appropriate to the strength of evidence and level of risk, including changes to processes, standards and specifications, the need to increase RB Rail’s knowledge and skill base, measures that increase the resilience of the assets to current and future impacts, and cost-efficient adaptations and investments.
The measures also include the creation of a monitoring and warning system, implemented within the Rail Baltica weather service, which would measure and predict high and low temperatures and flooding.
The increased likelihood of heavy rains and flooding could affect the track and embankments, resulting in instability problems in cuttings, tunnels and lowlands with unfavourable runoff and drainage conditions. To adapt to this, the report suggests changes to planning documents, along with updated flood zone modelling and high-water level and peak flow calculations.
Stronger winds and more frequent storms pose a medium to high risk, potentially causing failures or damage to structures and other infrastructure. The report identified a need for multi-hazard risks, such as high wind in combination with snow, freezing rain or glazed frost, to be assessed during the creation of specifications for catenary and other sensitive systems, while wind corridors will need to be determined and infrastructure designed accordingly. Areas where a 40m-wide tree-free zone cannot be implemented will also need to be identified, with a monitoring system and other mitigation measures created.
A lightning risk assessment should consider the possibility of more frequent thunder clouds with more severe consequences in the future, while adequate lightning protection measures for signalling, telecommunication and power supply equipment will be considered.
To combat low temperatures, utilities must be located deep enough or insulated to prevent liquids travelling through them from freezing. Casing pipes must also eliminate the possibility for leakage into the soil and embankments should breakages occur.
The specification of technical requirements for points, catenary and overhead power lines should consider the trend towards milder winters with more precipitation and increased likelihood of wet snow, freezing rain and glazed frost events.
The report recommends the development and implementation of a maintenance system which includes principles of systematic monitoring and forecasts along with the required tools and machinery.
Technical solutions and materials to decrease the risk of slippery surfaces should be installed in passenger areas exposed to climatic variables like rain, snow, ice, freezing rain and glazed frost.
A Frost Index or Freezing Index (FI), and average annual air temperature data, covering the whole Rail Baltica corridor, should be developed, with input for selecting the appropriate countermeasures such as necessary thickness of a granular frost protection layer, while design solutions should incorporate the results of the FI.
Rising temperatures present an increased risk of thermal expansion joints going beyond their design capability, presenting a direct risk of damaging bridge structures and indirect risk of damage to other assets dependent upon bridges.
While the adaptive measures are focused mainly on the design and implementation phase, the results will continue to affect the way the line is operated and managed due to the long-term nature of climate change.
Although climate change could have a strong impact on the project, the effects could be more pronounced on similar projects elsewhere in the world, as the report notes that the risks relating to climate change are relatively low in the Baltic States compared with Central or Southern Europe.
“This study keeps in mind the construction, operation and maintenance periods, thus giving additional information to the future infrastructure manager as well as the potential operators for their services,” Ivanovs says. “This will help them better prepare, be more proactive and decrease the response time in different situations as the risk and mitigation plans are already in place.”
Baltic Climate variables
Future climate predictions for 2017 - 2100, compared with 1961-1990
Mean air temperature >+3.5°C
Maximum air temperature
>+3.4°C
Minimum air temperature
>+9.5°C
Summer days
+31 days
Frost days
-52 days
Total precipitation
+13%
Heavy precipitation days
+3 days
Annual mean wind speed
-3% (uncertain)