RAIL transport relies heavily on the integrity of its infrastructure. The Rail Surface Inspection System (RSIS) is designed to offer a methodical approach to improve how rail surfaces are assessed and maintained. By incorporating machine vision technology, RSIS provides a more measured and data-driven process for identifying rail surface damage, moving away from the more traditional, manual inspection methods.
Historically, rail surface assessment has relied heavily on visual inspection and manual measurement. While these methods have served the industry for decades, they come with significant limitations. Human inspectors can miss small cracks or imperfections, especially when they are new or hidden beneath dirt and rust. Moreover, the subjective nature of visual inspection can lead to inconsistent assessments, making it difficult to track the progression of wear or damage over time.
The consequences of undetected or misjudged rail surface defects can be dire. Cracks can propagate under the stress of passing trains, leading to rail breaks that may result in derailments. Similarly, undetected wear can lead to rail head defects, compromising the wheel-rail interface and potentially causing accidents. Thus, the need for a more precise, objective, and consistent method of rail surface assessment is not just a matter of improving maintenance routines; it is a critical safety concern.
The shift towards advanced rail surface assessment methodologies is driven by the need to overcome the limitations of traditional inspection methods. Advanced systems like RSIS employ sophisticated imaging technologies and data analysis algorithms to detect and quantify rail surface defects with a level of precision that human inspectors cannot achieve.
These systems use high-resolution cameras to capture detailed images of the rail surface as inspection vehicles travel along the track. The images are then analysed using specialised software that can detect a wide range of surface anomalies, from the smallest cracks to the early signs of spalling and corrugation. This level of detail enables maintenance teams to identify potential issues long before they become visible to the naked eye.
Data plays a central role in advanced rail surface assessment. RSIS, for example, generates a wealth of data on rail surface conditions, including measurements of crack density, depth, and orientation. This data can be integrated with information on rail geometry, wear patterns, and traffic loads to create a comprehensive picture of rail health.
The ability to track changes in rail surface conditions over time is another advantage of advanced assessment systems. By comparing data from successive inspections, maintenance teams can identify trends and predict when and where defects are likely to worsen. This predictive capability is essential for planning maintenance activities, allowing railways to address issues proactively rather than reactively.
At its core, RSIS is about precision and prevention, using high-resolution linescan cameras to capture the minutiae of rail surface conditions that are invisible to the naked eye.
Linescan cameras scan the rail surface as the inspection vehicle moves along the track. They capture images with a minimum resolution of 0.4mm at speeds up to 105km/h, ensuring that even at high speeds, the system does not compromise on the level of detail captured. This high-resolution imaging is crucial for detecting the early stages of rail surface defects, which can escalate into more significant issues if not addressed promptly.
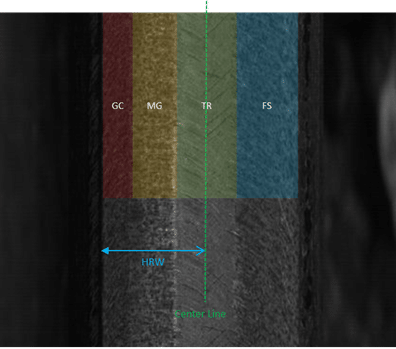
Once the continuous rail surface image is captured, it is segmented into five longitudinal bands. This segmentation is not arbitrary; it reflects the areas of the rail that are most susceptible to different types of wear and damage and comprise:
- gauge corner: the part of the rail that comes into contact with the wheel flange - damage here can lead to derailments if not managed
- mid-gauge: this area is prone to rolling contact fatigue (RCF) due to the high stresses it experiences
- top of rail: the uppermost surface where the wheel sits, which can be affected by slip-stick action and can develop corrugations or other wear patterns
- field side: the side opposite the gauge face, which can show damage due to wheel-rail interaction dynamics, especially on curves, and
- full rail width: a comprehensive view that helps in assessing the overall condition of the rail head.
With the latter, each band is further divided into 300mm segments, which is a strategic choice. This size corresponds to the data intervals of track geometry and rail wear data, allowing for a direct comparison and integration with existing maintenance data sets.
The segmentation into bands allows for targeted analysis of specific areas of the rail, crucial for identifying localised issues such as RCF and other forms of surface damage.
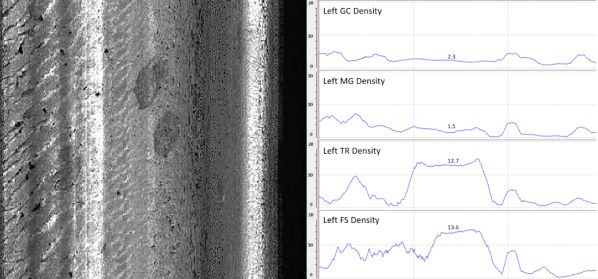
For each 300mm segment, RSIS calculates several critical parameters:
- RCF crack density: this measures the total area of RCF cracks within a segment, providing a density figure that helps in assessing the severity of the condition
- average crack width: by measuring the average width of RCF cracks, maintenance teams can determine the stage of the fatigue process
- average crack angle: the angle of RCF cracks can indicate the type of stresses the rail is subjected to, which is vital for determining the root causes of rail damage
- surface damage area: this ratio measures the area of surface damage within a segment against the total area, giving a clear indication of the extent of surface degradation, and
- rail surface index: a composite index that weighs the above parameters into a single value, providing a quick reference to the overall condition of the rail segment.
Insights for maintenance
The RSIS methodology is not just about detecting and quantifying rail damage; it is about providing strategic insights that can guide maintenance decisions. For example, the detection of RCF on the gauge face in tangent track sections near spirals can inform track engineers about the dynamic behaviour of trains exiting curves, which can lead to targeted adjustments in track geometry or rail profiles to mitigate these forces.
The RSIS data integrates seamlessly with existing rail maintenance protocols. The strip charts generated by RSIS can be used alongside traditional track geometry and rail wear data, providing a more comprehensive understanding of rail condition. This integration is crucial for planning maintenance activities such as grinding, where RSIS data can help in identifying the exact location and extent of rail surface damage, ensuring that grinding operations are targeted and effective.
Two software tools - GeoEdit 8 and Virtual Track Walk - are key elements of the RSIS. GeoEdit 8 is used to view strip chart data and rail profiles, while Virtual Track Walk allows for visualisation of the imagery. These tools are synchronised, enabling users to simultaneously view strip chart data and imagery at any given location on the track.
RSIS employs a two-step algorithmic process to quantify rail surface condition. The first step involves detecting whether the rail surface has been ground, adjusting calculations accordingly to avoid misinterpretation of grinding marks as surface defects. The second step involves the segmentation of the rail surface into different bands and the calculation of various condition values.
This visual representation in the RSIS data highlights the extent of damage and aids in pinpointing areas that require immediate attention.
Field data collected using RSIS has led to several unique findings. Preliminary evaluations have identified areas of RCF and rail surface spalling associated with track geometry conditions. Moreover, RSIS has revealed interesting rail surface conditions not only within curves and spiral locations but also in tangent sections near spirals.
For example, RSIS has detected unground sections within curves, such as at level crossings, where rail grinding equipment cannot operate. It has also identified significant RCF at tangent sections near spirals, suggesting that rail vehicles do not reach a steady-state position immediately after exiting a curve, leading to RCF damage due to oscillating wheel flanges.
Ultrasonic rail flaw testing is a critical component of rail maintenance. RSIS data can be used to plan for successful ultrasonic tests by identifying sections with surface conditions that may interfere with testing, such as shelled, spalled, or corrugated (SSC) areas.
The introduction of RSIS has the ability to transform detailed visual data into practical analysis, aiding in the meticulous planning of rail maintenance. While RSIS enhances the precision of pre-grinding inspections and the identification of rail surface issues, its true value lies in its contribution to the systematic upkeep of rail infrastructure. This should not only prolong rail life but also help to improve the safety and efficiency of rail transport.