TESTING on the US Federal Railroad Administration’s (FRA) High-Speed Adjustable Perturbation Slab (HS-APS) test facility at the Transportation Technology Center (TTC) near Pueblo, Colorado started in 2015. This 152m-long section of tangent slab track was designed to allow installation and removal of precisely controlled vertical and lateral track geometry deviations.
There are two main objectives for the HS-APS involving the evaluation and testing of:
- track geometry measurement systems to verify their accuracy and repeatability under a range of controlled operational conditions, especially for high-speed inspection, and
- the dynamic response of rail vehicles to specific vertical and lateral track geometry deviations.
Validation of track geometry measurement systems and vehicle/track interaction testing are two critical functions for the safe operation of railways, especially for high-speed passenger operation. For the first, FRA is developing a comprehensive test procedure to evaluate the accuracy of vehicle-borne track geometry measurement systems, especially for high-speed track geometry inspection.
To date, track geometry measurements made from a moving platform are often assessed by comparing limited measurement parameters such as gauge and cross level at discrete locations with static measurements made with a hand measurement tool, or by conducting repeatability analyses of track geometry measured at different speeds and directions of travel. This practice, albeit helpful, does not give a sufficiently accurate assessment of vehicle borne measurements. In addition, track geometry measurements can be repeatable and reproducible but not necessarily accurate.
For the second critical function, vehicle performance specifications require analysis and/or testing of a vehicle’s dynamic response to specific track geometry perturbations, such as the Minimally Compliant Analytical Track (MCAT) federal regulation, and the perturbations specified in the Association of American Railroads’ (AAR) Manual of Standards and Recommend Practices for testing new freight vehicles.
Although these specifications may not always require testing over track geometry perturbations, vehicle designers and analysts often want to perform such tests on controlled track geometry perturbations to benchmark analyses and validate computer simulation models.
To address these needs, the HS-APS was designed and built with precisely adjustable track geometry and track property - stiffness and damping - variations. It is part of the existing high-speed Railroad Test Track (RTT), a 21.7km loop with a maximum speed of 266km/h in tangent sections and a limiting speed of 212km/h in a 1400m-radius reverse curve.
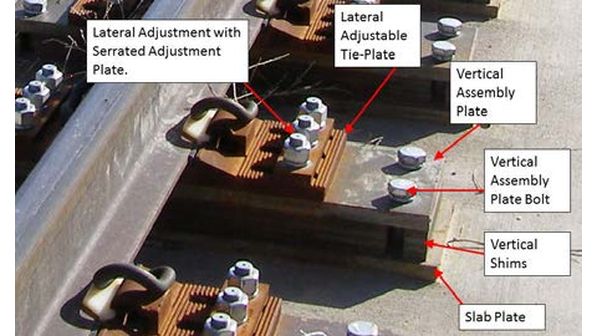
The tangent portion of the RTT high-speed test loop includes a slab track with specially designed sleeper plates that are adjustable so that a maximum vertical perturbation of 44.5mm can be installed while a lateral adjustment of 38.1mm is possible on either rail. Specially designed plates and shims allow track geometry deviations of 3.2mm (Figure 1). By using rail seat pads or vertical shims with different rubber pads, various track stiffness and damping properties can be achieved. This test track can be used to create different types of track geometry perturbations at different wavelengths, including surface, gauge, alignment, cross level deviations, and their combinations.
Older rails used in this section of the track were replaced with new rails, as the wear and deformation at the welded joints of the older rails affected the accuracy of the installed track perturbations. To facilitate the creation and adjustment of track geometry perturbations with various amplitudes and wavelengths, expansion joints were installed outside but adjacent to the test section.
Wayside instrumentation was installed to measure vertical and lateral wheel-rail forces along the test section and to quantify vertical and lateral track component deflections under train operation.
For the wheel-rail force measurement, 10 locations were selected along the test section to capture their variations corresponding with various perturbations under different testing speeds. All the circuits and transducers were calibrated prior to testing with a portable calibration fixture or a test vehicle that can apply and measure vertical and lateral wheel loads to the rails.
Ground truth measurements are intended to capture the true shapes of track geometry perturbations under unloaded conditions. TTCI used several survey methods for the ground truth measurements, including:
- lateral track alignments using a total station referenced from the established HS-APS centreline
- top of rail (TOR) elevation (vertical profile) surveys using an optical level referenced to a benchmark, and
- a portable track geometry measurement system.
All three methods required the installation of permanent survey benchmark monuments. A portable track geometry measurement system can provide alignment, surface, gauge, cross level and curvature measurement. The first two measurements are performed by hand from one sleeper to the next and are time-consuming. The third method requires post processing/filtering to produce the ground truth data. FRA is currently developing an improved and automated method for ground truth measurement.
Since 2015, several on-track testing programmes have been conducted on HS-APS with various perturbations, including activities for the first and second objectives and critical functions.
The main objective of a testing programme conducted by a project team including TTCI, Volpe, Ensco, and FRA was to obtain test results to support the FRA in developing and evaluating the track geometry measurement system (TGMS) evaluation procedure. The project team used the FRA’s DOTX-216 TGMS over the HS-APS with various introduced track geometry perturbations. As the TGMS evaluation procedure remains under development, test results obtained so far illustrate how the HS-APS was used. Under the programme, nine track geometry perturbations were installed, tested and removed:
1 - no perturbations
2 - single 9.5m, 19mm amplitude vertical perturbations installed at the ends of the HS-APS outside the central test zone
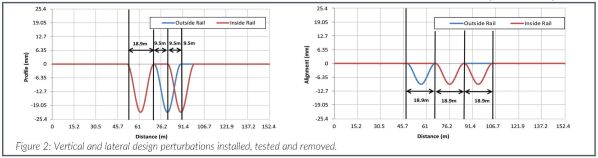
3 - combined vertical profile and cross-level perturbations: two sets of 18.9m, 22mm amplitude, sinusoidal profile perturbations, in the central test zone
4 - combined 37.8m, 22mm amplitude, profile and cross-level perturbations in the central test zone
5 - combined 9.5m, 16mm amplitude, profile and cross-level perturbations in the central test zone
6 - blind test - combined profile and cross-level perturbations installed at the ends of the HS-APS
7 - single 9.5m, 13mm amplitude, alignment perturbations installed at the ends of the HS-APS
8 - combined 18.9m, 10mm amplitude, in and out of phase alignment perturbations in the central test zone, and
9 - blind test - alignment perturbations installed in the middle of the HS-APS test zone.
For the blind tests 6 and 9, the operators of the TGMS were not informed what the wavelengths and amplitudes of the perturbations were until after the measurements were completed. For the other perturbations, the TGMS operators were informed of the intended track geometry in advance.
Figure 2 shows two examples of vertical and lateral track geometry perturbations installed, tested and then removed. The plot on the left was the design perturbations as listed in test 3; and the plot on the right was the design perturbation in test 8.
For each design perturbation, the unloaded track geometry was measured using the survey equipment and the portable track geometry car to establish the ground truth reference. DOTX-216 was then tested over each perturbation at different speeds from 32 to 169km/h. The testing speed was limited by the maximum speed of the locomotive available. Each testing speed was repeated three times over the same test zone. The same number of tests at different speeds were also conducted in the opposite direction.
For the two design perturbations in Figure 2, the actual ground truth results obtained using the survey equipment are shown in Figure 3. The plot on the left shows vertical profile results of the two rails that had removed the actual grade of the test section (0.3%). The actual perturbation installed was close to the design perturbation shown in Figure 2 (left). The plots on the right show the actual lateral alignment results of both rails and the resulting gauge result for the design perturbation in Figure 2 (right). Although both rails were not perfectly straight, the designed alignment perturbations were indeed introduced, and the gauge variation also reflected these changes.
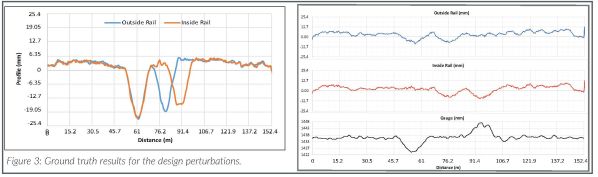
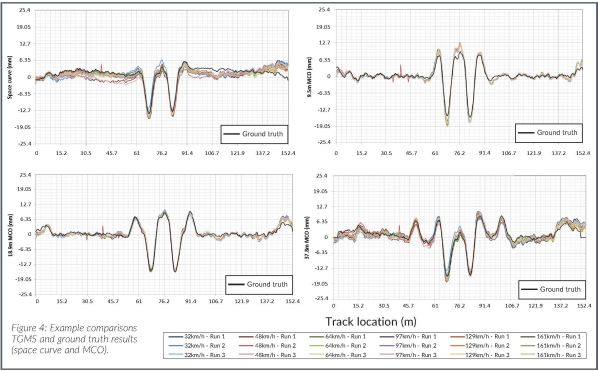
Figure 4 shows example vertical profile results (inside rail) from DOTX-216 for the design perturbation test 5 obtained under various testing speeds, including space curve results, mid-chord offset (MCO) results based on three chord lengths of 9.5m, 18.9m and 37.8m. Ground truth data were also included for comparisons with TGMS results, processed in terms of space curve and MCO formats. Vertical profile results can appear differently depending on whether they were processed in terms of space curve or MCO, while chord length can also affect the results significantly.
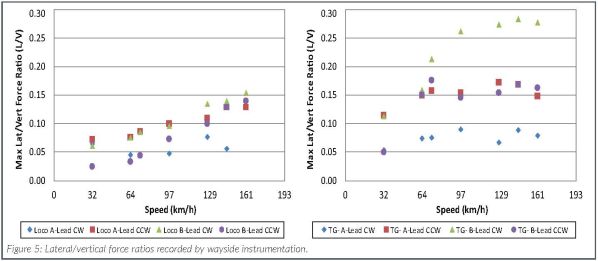
During all test runs, the research team monitored vehicle dynamic response of the DOTX-216 and the locomotive (DOT-203), as well as the track component deformation, using onboard transducers and wayside instrumentation. For all the design perturbations tested, vertical and lateral wheel-rail forces, and lateral to vertical force ratios (L/V or Y/Q) were all well within FRA CFR and AAR Chapter 11 limits, with the maximum L/V ratio below 0.3. Figure 5 shows L/V ratio results recorded under the locomotive and TGMS at various speeds over design perturbation test 4.
For all test runs conducted, the maximum lateral rail displacement was 1.3mm, and the maximum rail roll angle was 0.5°. The maximum slab deflections were insignificant - less than 0.6mm vertically and 0.6mm laterally.
Test results and findings from HS-APS are being used to develop the procedure for verifying and improving track geometry measurement systems and vehicle/track interaction. The test facility has great potential to improve the measurement accuracy of track geometry inspection vehicles and improve passenger vehicle designs based on their responses to various track geometry perturbations and track properties.
Lessons learned and recommendations include: for testing on the HS-APS, blind tests should be included to evaluate any TGMS to ensure impartiality of the test and evaluation process; design perturbations should include wavelengths that are not standard FRA chord lengths; and heat waves and wind can affect accuracy and repeatability of survey measurements significantly for ground truth.
For the design and construction of the HS-APS, lateral adjustment should allow the correction of initial alignment not perfectly centred; finer adjustment smaller than 3mm is needed to accurately install exact lateral sinusoidal shapes; designs that minimise bolts used are better for long-term use due to less wear on bolts and fewer broken bolts; and variations in ambient temperature can affect perturbations - expansion track joints are needed to allow the rails to breathe.
FRA plans to design and install another HS-APS in a section of curved track on the RTT. The design of this new curved HS-APS is underway and will consider the lessons learned from the HS-APS installed on tangent track.
This article is based on a submission to the World Congress on Railway Research 2019, which won the best paper award in the Railway System Interface category.